Type II radio bursts, produced near the local plasma frequency and/or its harmonic by energetic electrons accelerated by shock waves moving outward through the inner heliosphere, have long been recognized as evidence of shock waves origin and propagation in the solar corona.
In this work, we analyze the early evolution of a coronal shock wave, associated with a prominence eruption, with the aim of investigating the properties of the compressed plasma through both radio and Extreme-Ultra Violet (EUV) data.
Observations and Analysis
On 2014 October 30, a solar eruption occurred at the east limb in active region NOAA 12201 (S04E70) involving a C6.9 flare, a CME, and a type II radio burst starting at about 13:08 UT.
Analysis of Radio data
The type II radio burst, also observed by the Nancay RadioHeliograph (NRH), was rather complex, as evinced by inspecting the compound radio dynamic spectrum obtained by combining data from the Compound Astronomical Low-cost Low-frequency Instrument for Spectroscopy and Transportable Observatory (CALLISTO) station located in Birr, Ireland (BIR) and the USAF Radio Solar Telescope Network (RSTN) spectrometer located in San Vito, Italy (see Figure 1).
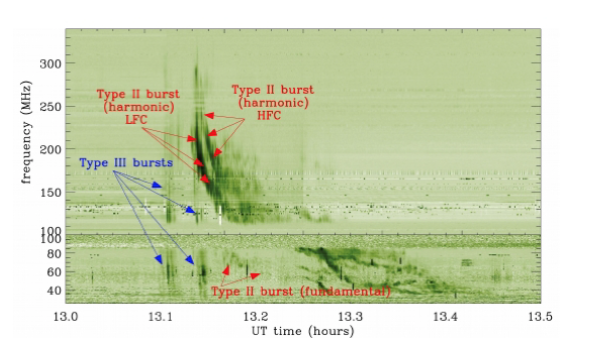 Figure 1 – Radio dynamic spectrum obtained from CALLISTO (mid and high frequencies) and RSTN (low frequencies).
The harmonic component was split into two sub-bands, a lower (L) and an upper (U) frequency component, most probably due to shock/streamer interactions (discussion in Mancuso et al. 2019 paper). The further splitting of the upper harmonic band, visible in the time interval between 13:08.5 UT and 13:08.7 UT, is instead attributable to simultaneous radio emission occurring in the upstream (ahead) and downstream (behind) regions of the shock front. Under the above assumption, we calculated the compression ratio Xradio of the expanding front as:
\[X_{radio}=\frac{n_{e}^{D}}{ n_{e}^{U}}=\frac{f_{U}^{2}}{ f_{D}^{2}} \tag{1} \]
The calculated Xradio values lie between 1.1 and 1.4 in the temporal range [13:08:30 – 13:09:00] UT.
Analysis of Extreme Ultra-Violet data
EUV data from SDO/AIA (Figure 2, left panel) were used to estimate the temperature of the emitting plasma and to infer the density compression ratio, XEUV, from emission measure (EM) modeling.
Temporal variations of the observed EUV intensities related to the evolution of the electron density and ionization state (depending on temperature) of the plasma were used to infer the presence of the shock from the images.
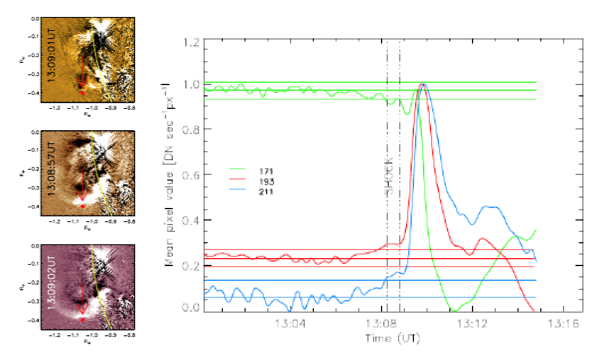 Figure 2 – Left Panel:SDO/AIA running difference EUV images of the event at 171 Å (top), 193 Å (middle), and 211 Å (bottom). Right Panel: Temporal dependence of the intensity fluxes in the 171 Å, 193 Å, and 211 Å channels as measured in the red filled-dot region marked by a red arrow in the left panel.
The shock wave front was clearly detected in three of the SDO/AIA channels (171 Å, 193 Å, and 211 Å) and it was distinctly separated from the CME bubble represented by the observed expanding EUV front. Moreover, given the temperature response of each of the used AIA filters, the emitting plasma temperature was estimated in the range of 1.75 – 4.00 MK.
From the EM (Eq. 2), representing the amount of emitting material as a function of coronal plasma temperature along the line of sight (LOS), we calculated the plasma electron density and the compression ratio XEUV (Eq 3., see Frassati et al. 2019 and Frassati 2020 for more details).
\[EM\simeq\int_{\rm LOS}n_{\rm e}^2\mathrm{d}L , \tag{2}\]
\[X_{\rm EUV} = \sqrt{\frac{EM_{\rm D}-EM_{\rm U}}{P_{\rm U}}+1}, \tag{3}\]
where EMU and EMD are the up- and downstream EMs and PU is the contribution to the pre-event EM from the coronal plasma region located in the plasma region being compressed after the transit of the EUV front.
The calculated value XEUV ≈ 1.23 at 13:08:45 UT and for T = 2.5 – 3.0 MK is in good agreement with what estimated from the above type II band-splitting analysis.
From the Differential Emission Measure, $DEM(T)=n_{e}^{2}(\frac{dT}{ds})^{-1}$, we inferred the peak upstream temperature TU ≈ 1.78 MK and, using the results from Mancuso et al. (2019) together with the Rankine-Hugoniot jump conditions, we estimated the post-shock temperature, TD ≈ 2.75 MK, under the usual hypothesis that the shock was perpendicular.
Conclusions
In this work, we analyzed a peculiar coronal event that occurred on 2014 October 30 in which both a type II radio burst and a CME- driven shock were identified.
The type II emission was observed during the lateral over-expansion phase of the CME bubble; to this respect, the intersection of coronal loops and streamers might be a fundamental factor for the formation and/or enhancement of the shock and the excitation of type II emission (see Mancuso et al. 2019). The presence of the type II radio burst in the low corona at the time and location where the EUV front was identified, together with the comparable values of compression ratios derived from the analysis of both radio and EUV data, concur to indicate that the observed EUV front was, in fact, a CME-driven shock wave.
Additional info
We are grateful to the SDO/AIA teams, the Radio Solar Telescope Network (RSTN), and the e-CALLISTO network for providing open data access.
Disclosure of Potential Conflicts of Interest
The authors declare that they have no conflicts of interest.
References
Frassati, F., Susino, R., Mancuso, S., Bemporad, A.: 2019, Comprehensive Analysis of the Formation of a Shock Wave Associated with a Coronal Mass Ejection. Astrophys. J. 871, 212. DOI. ADS.
Frassati, F., Mancuso, S. & Bemporad, A. Estimate of Plasma Temperatures Across a CME-Driven Shock from a Comparison Between EUV and Radio Data. Sol Phys 295, 124 (2020). https://doi.org/10.1007/s11207-020-01686-0. ADS
Mancuso, S., Frassati, F., Bemporad, A., Barghini, D.: 2019, Three-dimensional reconstruction of CME-driven shock-streamer interaction from radio and EUV observations: a different take on the diagnostics of coronal magnetic fields.Astron. Astrophys.624, L2. DOI. ADS.
Full list of authors: Federica Frassati1, Salvatore Mancuso1 and Alessandro Bemporad1.
1 Istituto Nazionale di Astrofisica, Osservatorio Astrofisico di Torino, via Osservatorio 20, 10025 Pino Torinese, Italy