The small-scale temperature structure of prominences remains an outstanding question in solar physics. Theoretical models provide scenarios for how cool prominence plasma can be formed and maintained within the extreme conditions of the corona. However, knowledge of the detailed temperature structure of the prominence plasma and its evolution at small spatial and temporal scales is still lacking. The Atacama Large Millimeter/sub-millimeter Array (ALMA) provides a novel method for high spatial resolution imaging of the solar atmosphere combined with the capability of direct thermal diagnostics. The purpose of this study (Rodger et al. 2017) is to develop our understanding of the formation of the millimeter continuum in solar prominences with a view to prepare for the analysis of future ALMA prominence observations.
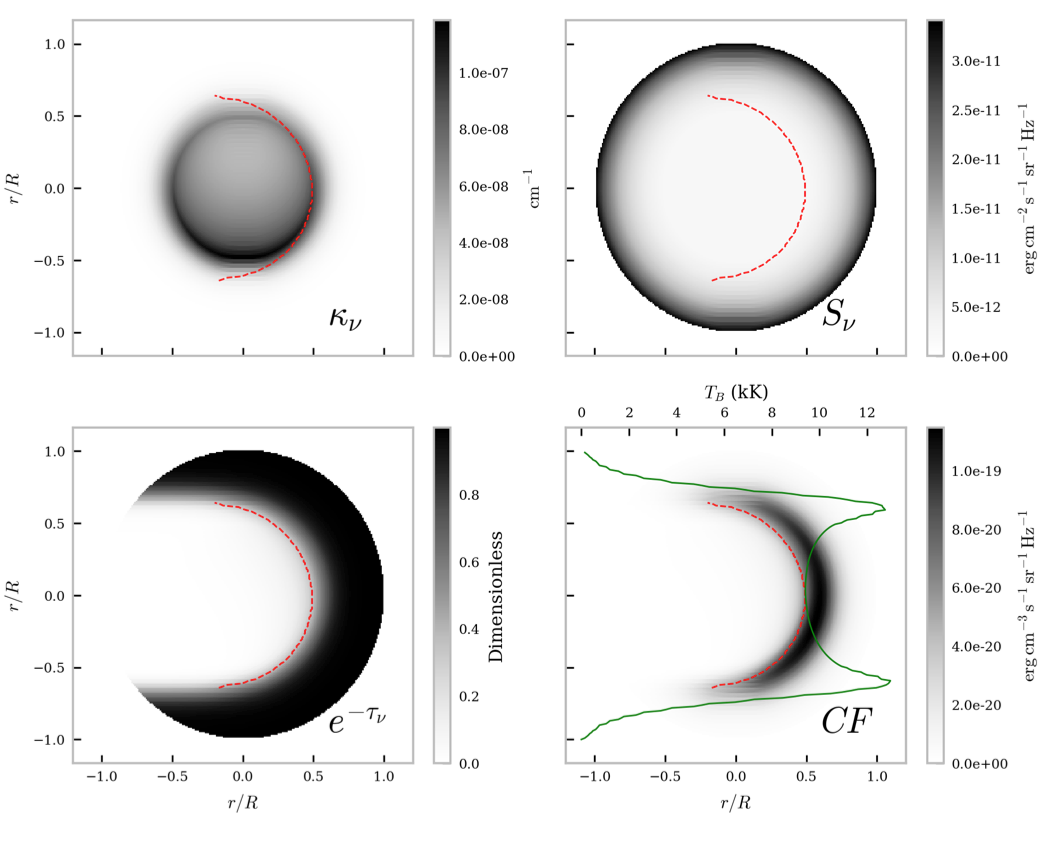
Figure 1. Formation of 9.0mm continuum radiation from a non-isothermal cylindrical prominence thread (Pressure 0.2 dyn/cm2). Top left panel – absorption coefficient; top right – source function; bottom left – optical thickness attenuation. Bottom right – contribution function as the product of the other three panels. The red dashed line shows the tau=1 line. The green line shows the resulting brightness temperature after integration over the line of sight.
Modelling
To model solar prominences we use the 2D cylindrical non-local thermodynamic equilibrium (non-LTE) radiative transfer code of Gouttebroze et al. 2009. From this the non-LTE hydrogen, helium and electron densities are used to calculate the corresponding absorption coefficient. For quiet sun mm continuum the absorption coefficient is dominated by free-free processes (ion-electron bremsstrahlung and H minus absorption – see Wedemeyer et al. 2016). The brightness temperature was calculated for a given line of sight via the following equation;
\[ T_{\mathrm{B}} = \int \kappa_{\nu} T \mathrm{e}^{-\tau_{\nu}} \mathrm{d}s \tag{1}\]
where $T$ and $T_{\mathrm{B}}$ are the local kinetic temperature and the brightness temperature respectively. $\kappa_{\nu}$ and $\tau_{\nu}$ are the frequency dependent mm continuum absorption coefficient and optical thickness, respectively and $s$ is the path of integration.
Our study considered two distinct sets of prominence models; isothermal-isobaric fine-structure threads and non-isothermal full prominence width models. We present some results from both sets here.
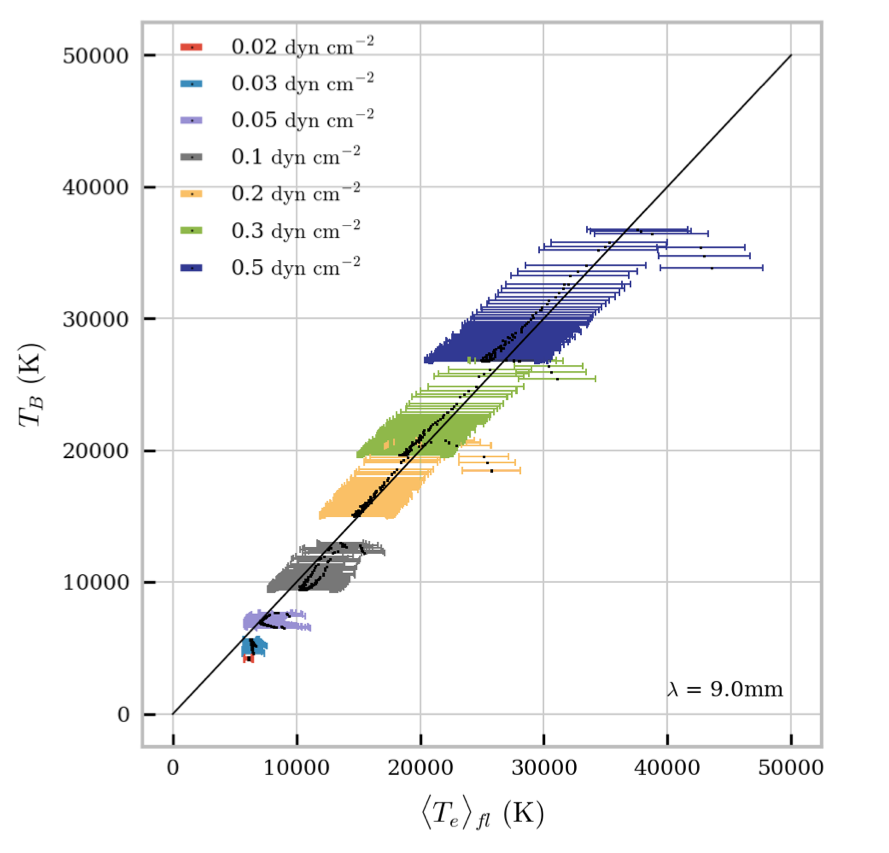 Figure 2. Relationship between observed brightness temperature and contribution function weighted mean kinetic temperature from the formation region of a non-isothermal prominence thread. The observation wavelength is 9.0 mm and the pressure of the prominence is 0.1 dyn/cm2.
Results
The relationship between observed brightness temperature and true kinetic temperature from a prominence varies depending on whether the plasma is optically thick or thin at the observed wavelength. In figure 1 we show the formation of mm continuum radiation from a non-isothermal prominence thread. The resulting contribution function is highly peaked in a crescent-shaped formation region at the location where the plasma becomes optically thick at the observed wavelength (here 9.0 mm, ALMA band 1). This immediately shows that, for optically thick plasma, the continuum radiation is formed in a specific region. The resultant brightness temperature distribution across the field of view shows this effect as the lines of sight traversing through optically thick, yet higher temperature transition region material produce peaks in brightness temperature at the top and bottom of the thread.
Figure 2 shows the relationship between the observed brightness temperature and the mean kinetic temperature of the formation region. The formation region is defined as the area within the line of sight where contribution is 70% or greater than the max contribution function. This figure shows a clear and direct relationship between observed brightness temperature and temperature of emitting material, as expected.
The analysis becomes more complicated when considering optically thin plasma. The radiation is significantly less attenuated by the plasma allowing photons from across the entire line of sight to reach the observer. This creates a more uniform contribution function distribution such that the observed brightness temperature is not representative of the temperature at any given point in the prominence. From our set of large-scale prominence models, the prominence plasma can be expected to be either optically thick or thin for band 3 radiation (3 mm) and likely to be optically thin for band 6 (1.3 mm), the two ALMA bands currently available to solar physics.
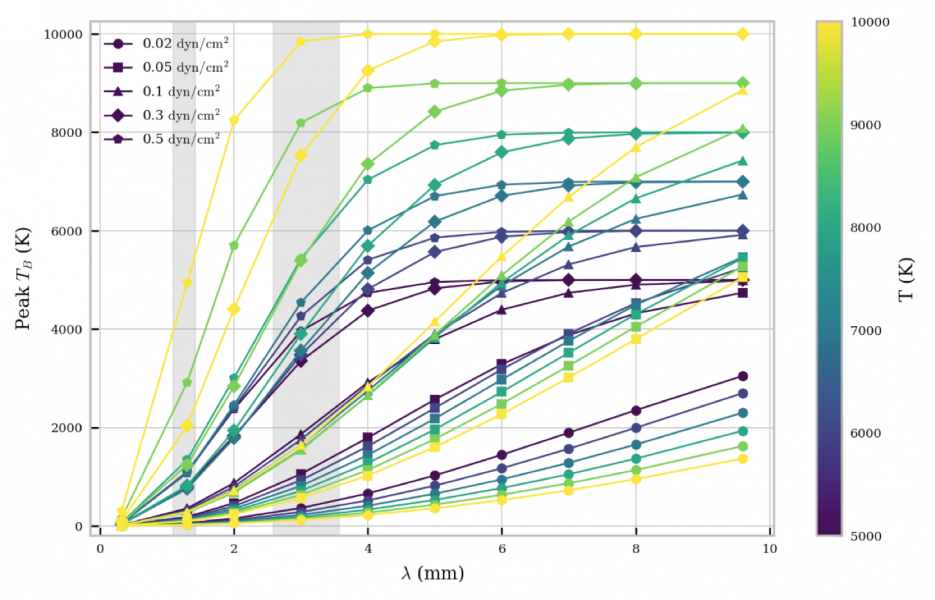 Figure 3: Relationship between peak calculated brightness temperature with wavelength in mm for a grid of isobaric-isothermal fine-structure prominence threads. Each curve corresponds to a given pressure and temperature.
Despite this, useful information can still be inferred if the observed structure can be assumed to be isothermal. In figure 3 we show the relationships between peak brightness temperature with pressure and temperature for a set of isothermal isobaric fine-structure prominence threads. Each temperature and pressure produces an individual brightness temperature curve, so that with the use of non-LTE modelling it is possible to match the observed brightness temperature to a given model. This becomes easier with multiple wavelength observations.
Conclusions
ALMA has the potential to unravel the thermal structure of solar prominences to unprecedented detail, however particularly in the case of optically thin radiation this will require the aid of suitable non-LTE radiative transfer modelling. We are looking forward to ALMA data from Cycle 5 observations to shed new light on the small-scale temperature structure of solar prominences.
Based on the recent paper: Rodger, A. and Labrosse, N., Solar Prominence Modelling and Plasma Diagnostics at ALMA Wavelengths, Solar Physics (2017) 292: 130. DOI: 10.1007/s11207-017-1161-9
References:
Rodger, A.S., Labrosse, N.: 2017, Sol. Phys., 292, 130
Gouttebroze, P., Labrosse, N.: 2009, A&A, 503, 663
Wedemeyer, S., Bastian, T., Brajša R., et al.: 2016, SSRv, 200, 1