Solar energetic particles (SEPs), especially protons and heavy ions, may be a space-weather hazard when they impact spacecraft and the terrestrial atmosphere. Forecasting schemes have been developed, which use earlier signatures of particle acceleration to predict the arrival of solar protons and ions in the space environment of the Earth.
The UMASEP (University of MAlaga Solar particle Event Predictor) scheme (Núñez 2011), forecasts the occurrence and the importance of an SEP event based on combined observations of soft X-rays, their time derivative and protons above 10 MeV at geosynchronous orbit. We explore the possibility to replace the derivative of the soft X-ray time history with the microwave time history in the UMASEP scheme.
To this end we construct a continuous time series of observations for a 13-month period from December 2011 to December 2012 at two microwave frequencies, 4.995 and 8.8 GHz, using data from the four Radio Solar Telescope Network (RSTN) patrol stations of the US Air Force, and feed this time series to the UMASEP prediction scheme.
During the selected period the Geostationary Operational Environmental Satellites (GOES) detected nine SEP events related to activity in the western solar hemisphere. We show that the SEP forecasting using microwaves has the same probability of detection as the method using soft X-rays, but no false alarm in the considered period, and a slightly increased warning time.
Methods
The UMASEP scheme (Núñez 2011) comprises two different procedures to forecast SEP events, which are referred to as “well-connected” and “poorly-connected” prediction models.
The UMASEP model for predicting well-connected events, called here WCP model, issues an SEP prediction if at least one of the correlations, with different, but physically plausible time delays, between the proton intensities in different energy channels and the soft X-ray flux is high, and if the associated X-ray burst is also strong (Figure1a).
In order to construct the tool UMASEP-10mw for predicting >10 MeV SEP events using microwave data, the time derivative of the soft X-rays was replaced by the microwave flux density, as illustrated in Figure 1b.
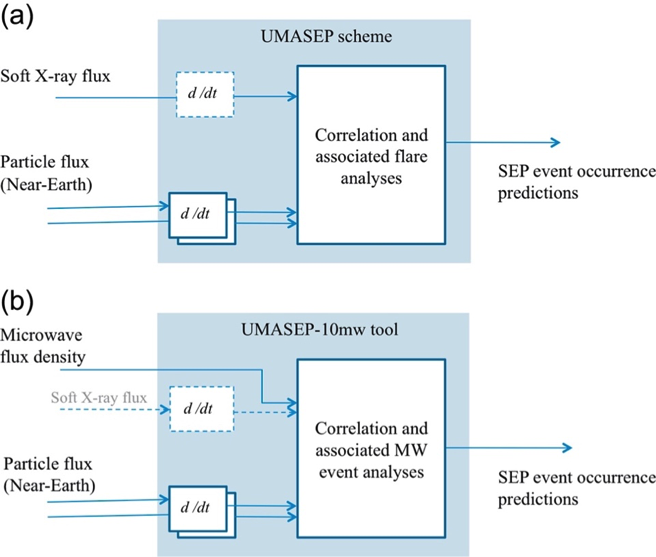
Figure 1. Schematic of the correlation process of the Well-Connected SEP forecasting module of the UMASEP scheme. (a) UMASEP-10, which correlates the time derivative of soft X-ray flux with the time derivative of the differential proton fluxes in different energy channels observed by the GOES spacecraft (9–500 MeV). (b) UMASEP-10mw, which uses the microwave flux density instead of the soft X-ray derivative.
Several procedures for a semi-automated correction of some of the problems of the RSTN data (e.g., spikes, different background levels, incorrect pointing near sunset and sun rise, station calibration periods) were developed and applied to the data. Figure 2 shows a sample 24-hr interval. In Figure 2a the original data are plotted for the four RSTN stations, while Figure 2b shows the corrected combined data after the semi-automatic procedure. Dips of the light curves in Figure 2a near the centres of the observing intervals are due to calibration periods.
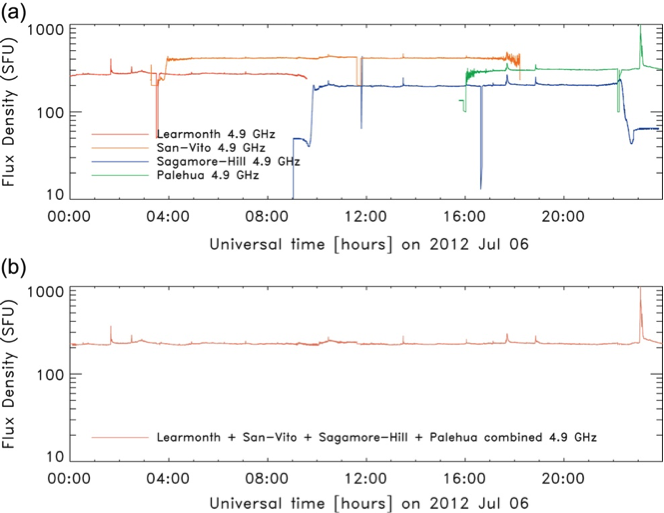
Figure 2. Example of microwave data for a sample 24-hr interval. (a) The flux density observed by the four RSTN stations at 4.9 GHz. Spikes, discontinuities and background are corrected in the combined flux density (b).
Results
We illustrate the forecast of the UMASEP-10mw tool using microwave data at 5 GHz for predicting the >10 MeV SEP event. We used independently the forecasting tools working exclusively with the soft X-ray derivative and exclusively with the microwave flux density, and compared their results.
Figure 3 shows an example of the forecast graphical output that an operator would have seen if the UMASEP-10mw tool had processed real-time microwave data on 2012 July 12. This figure also shows the inferences about the associated flare, heliolongitude and active region. The overall results of the tested 13 months period are reported in Table 1.
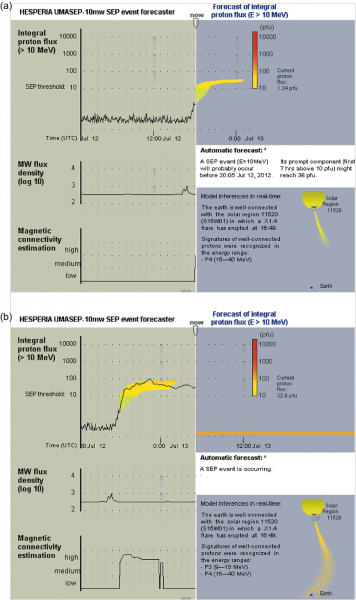
Figure 3. Two UMASEP-10mw outputs after processing microwave data at 5 GHz from 2012 July 12 and GOES proton fluxes of >10 MeV energies. (a) The prediction at 18:05. (b) The subsequent evolution of the >10 MeV integral proton flux. The yellow/orange band in the proton intensity plots gives the predicted range, with the colour scale shown by the vertical bar.
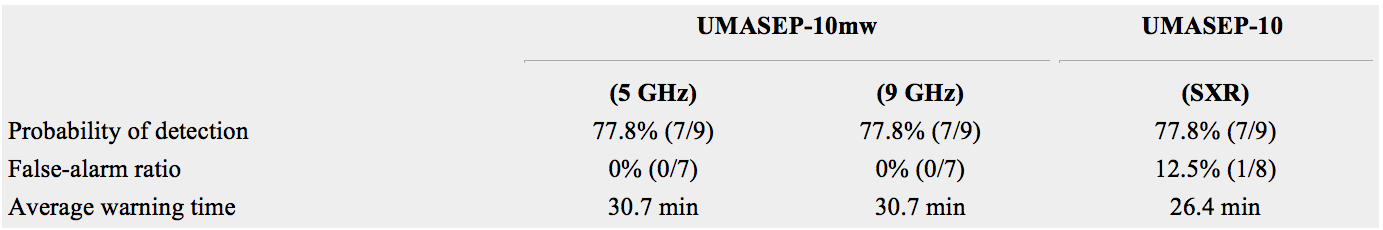
Table 1. Forecast performance results in terms of POD, FAR and average warning time of the UMASEP scheme (WCP model only) using microwave and soft X-ray (SXR) data from 2011 December 01 to 2012 December 31
Conclusions
An experimental run of the UMASEP prediction scheme of the occurrence of SEP events was presented, using microwave data as an identification of connection to a solar particle source. The key findings for a 13-month period from December 2011 to December 2012 are the following:
- The probability of detection is the same as in the traditional UMASEP scheme, where the derivative of the soft X-ray time profile is correlated with that of the SEP intensity.
- The false-alarm ratio is reduced to zero by the microwave data at both frequencies considered (5 and 9 GHz).
- The warning time obtained with the microwave light curves is slightly improved with respect to soft X-rays (30.7 vs. 26.4 min).
Microwave bursts, be they non-thermal gyrosynchrotron emission or thermal bremsstrahlung, are rarer than thermal soft X-ray bursts. The comparatively rare occurrence of the microwave bursts probably explains the low false-alarm ratio, because there is less probability for a chance coincidence with a rise of the proton profile. The radio observations exploited in the present work are carried out with rather simple patrol instruments, which monitor the whole-Sun flux density using parabolic antennas with a typical size of 1 m. Such data are presently not provided in real time, but there is no technical obstacle to do so.
Based on the recent paper:
Zucca P, Núñez M & Klein K-L. Exploring the potential of microwave diagnostics in SEP forecasting: The occurrence of SEP events. J. Space Weather Space Clim., 7, A13, 2017, DOI: 10.1051/swsc/2017011
References
Núñez M.: 2011, Space Weather, 9, 07003
*Full list of authors: Pietro Zucca, Marlon Núñez and Karl-Ludwig Klein