Intermittency is a disruptive characteristic of a process, which can be associated, in many cases, with a sudden energy release. Intermittency is a key characteristic of flares that should become evident in the flux time evolution at many different wavelengths. We investigate the similarities and differences of the intermittency during a solar flare in bremsstrahlung hard X-rays and synchrotron+free-free submillimeter emission. For this we chose a particular event that presents different time profiles at these two different wavelengths.
The LIM2 Analysis
We apply the wavelet formalism to describe intermittent processes, as it was first developed by Farge (1992), who defined the local intermittency measure (LIM), and more recently by Dinkelaker & MacKinnon (2013b) who analyzed the hard X-rays flux produced during the impulsive phase of flares. The wavelet transform is both localized in time and in frequency (or timescale). This inherent capacity makes it ideal for identifying intermittent processes. By definition
\[LIM=\frac{WPS}{\langle WPS\rangle _t}\]
where WPS is the Wavelet Power Spectrum, and $\langle \rangle _t$ means time average for a given scale. It has been shown (Meneveau, 1991) that LIM2 is a good estimator of the Kurtosis of the wavelet coefficient distribution. A LIM2>3, means a departure from a Gaussian distribution and therefore, a local intermittent process. In this work we define a Cross-Wavelet Power Spectrum (and consequently its cross-LIM2 ) composed of two different wavelet functions, to reduce the mathematical artifacts of the wavelet transform and to enhance their coincidences.
We apply the LIM2 analysis to the flare SOL2012-03-13, which has been analyzed by Kaufmann et al. (2013) and Trottet et al. (2015). Our choice is related to the fact that hard X-rays data ≤300 keV show an impulsiveness that is not observed at high radio frequencies, although the latter present fast sub-second pulses. Radio data are provided by the Solar Submillimeter Telescope (SST) at 212 GHz while hard X-ray data are from the Fermi Gamma-ray Burst Monitor (GBM), both with sub-second high time resolution. Figure 1 shows the flux time evolution for the different wavelengths.
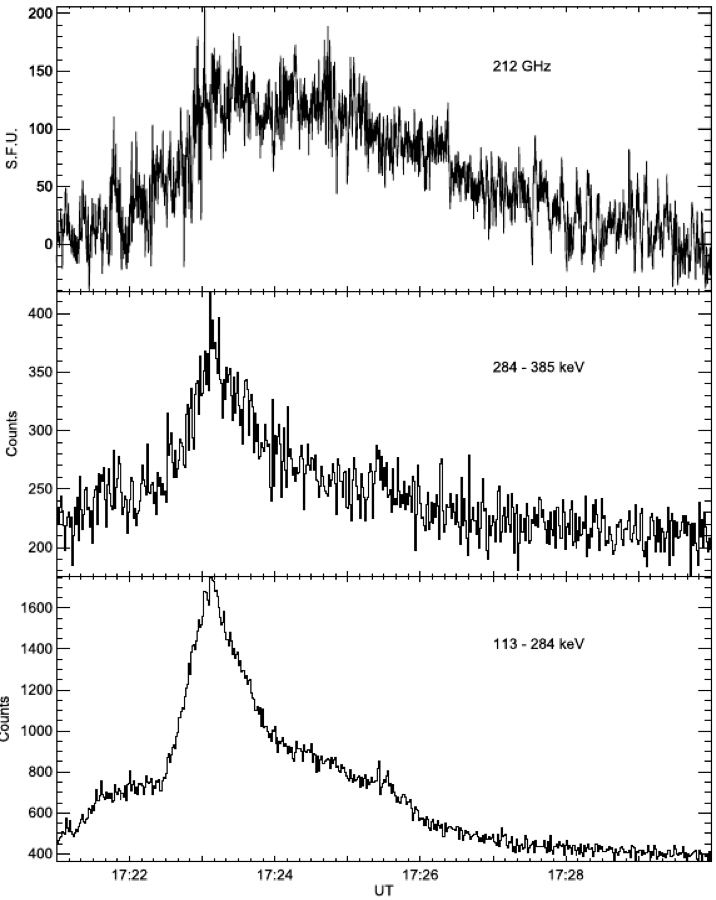
Figure 1. Flux density at 212 GHz (top) and counts for 284-385 keV (middle) and 113-284 keV (bottom) hard X-ray energy bands.
In Figure 2 and 3 we present the LIM2 color coded representations of the data, where the top panels are the submillimeter data and the bottom panels the hard X-rays with the scale axis inverted.
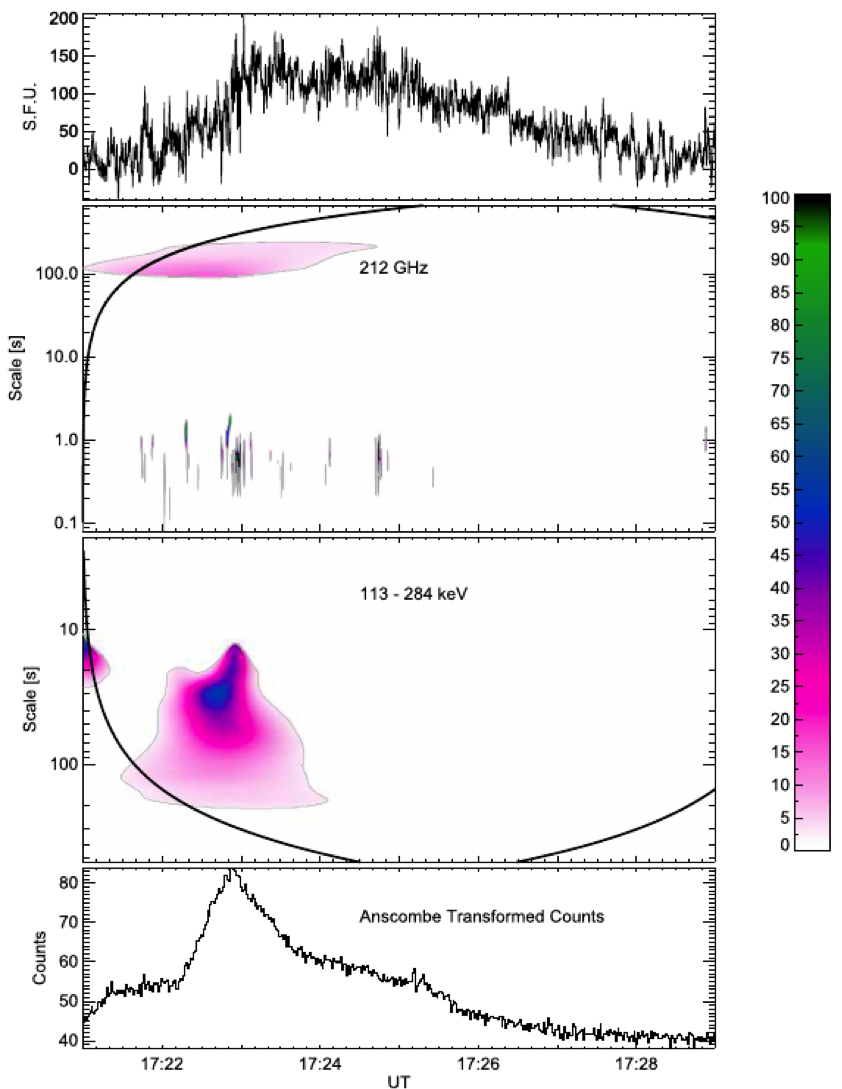
Figure 2. LIM2 representation in color code for 212 GHz (top) and 113-284 keV (bottom). The hard X-rays data were converted to a normal distribution by means of the Anscombe Transform (see text).
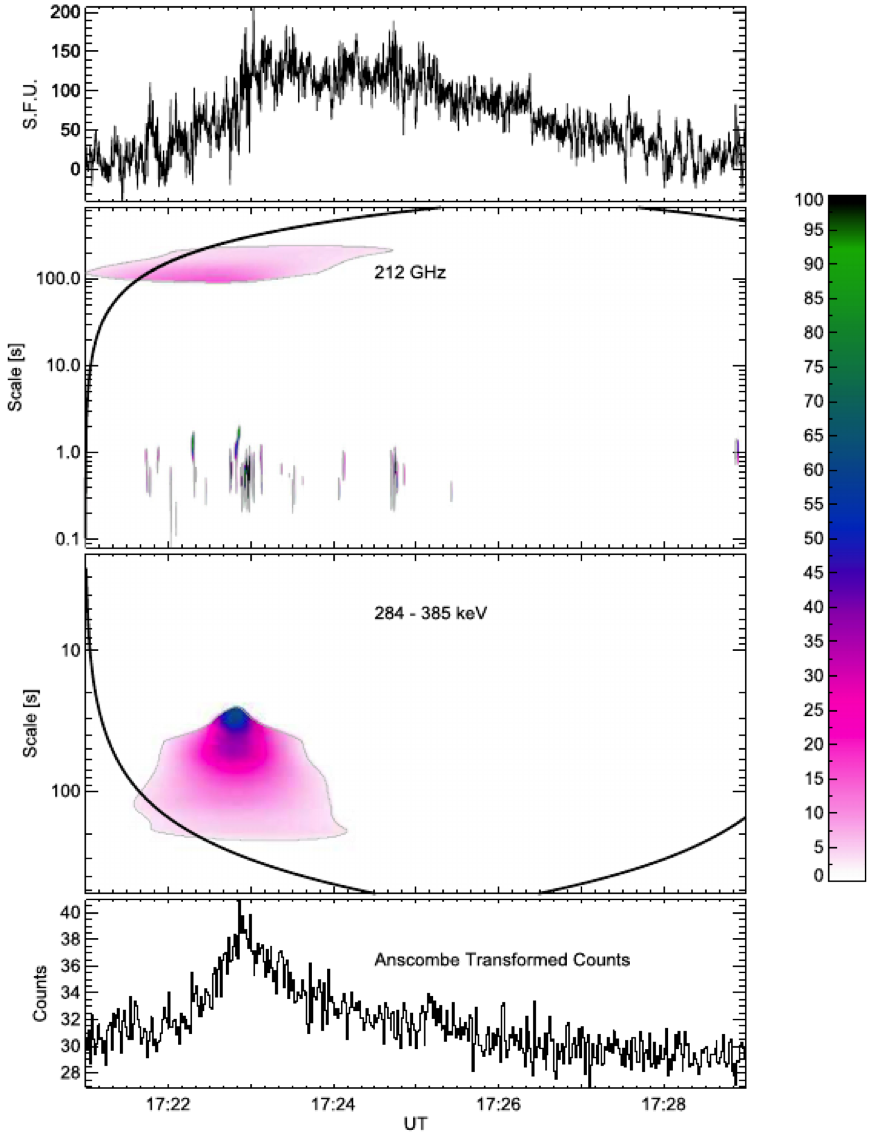
Figure 3. The same as in Figure 2 for 212 GHz and the 284-385 keV FERMI energy band.
Since we adopted the Torrence & Compo (1998) wavelet definition, which are for time series with Gaussian statistics only, we converted the hard X-ray data (which have Poisson statistics) to Gaussian by means of the Anscombe Transform. In both Figures we only show places where LIM2> 3 and that are significant respect to a predefined noise background. Therefore, all colored structures seen in the figures are representative of intermittent processes.
What is observed in both figures, is:
- A broad patch extending over many different time scales (in the ordinate axis) and with a long duration (in the abscissas axis). These hierarchical structures extend in time and scale differently at submillimeter and at hard X-rays.
- At submillimeter wavelengths, very short structures that increase in number and intensity during the hard X-ray peak.
- The intermittent processes are more intense at submillimeter than at hard X-rays. LIM2 are dimensionless quantities, so they can be compared between different physical quantities
Conclusions
At submillimeter wavelengths, it seems to be two different emission regimes: gradual for long time scales (> 100 s), and spiky for short time scales (< 1 s). The spiky regime is coincident in time with the peak at hard X-rays. Moreover, taking the classification introduced by Dinkelaker & MacKinnon (2013a), the broad patches, both at submillimeter and hard X-rays, are produced by a cascade mechanism, while the submillimeter spikes are representative of avalanches. In this analysis, the cascade produces emission at scales between 200 s (submillimeter) down to 10 s (hard X-rays), while the avalanche, produces the shortest time scales from 1 down to 0.1 s. If cascades and avalanches are produced by different acceleration mechanisms, our results can be used to constrain the models.
Additional info
The full work can be accessed here: http://adsabs.harvard.edu/abs/2016SoPh..291.2003G. Guillermo (Guigue) Giménez de Castro, corresponding author, can be reached at guigue@craam.mackenzie.br.
*Full list of authors: Guillermo Giménez de Castro1, Paulo José de Aguiar Simões2, Jean-Pierre Raulin1 and Odilon Guimarães Junior1
1 Centro de Rádio Astronomia e Astrofísica Mackenzie , Universidade Presbiteriana Mackenzie (Brazil).
2 School of Physics and Astronomy, University of Glasgow (UK).
References