De Pontieu, B., T. Tarbell, and R. Erdélyi, Correlations on Arcsecond Scales between Chromospheric and Transition Region Emission in Active Regions, ApJ, 590, 502-518 (2003) (ADS)
(click on the image for a larger version)
Date: 2004 February 27
Update: 2019 November 20
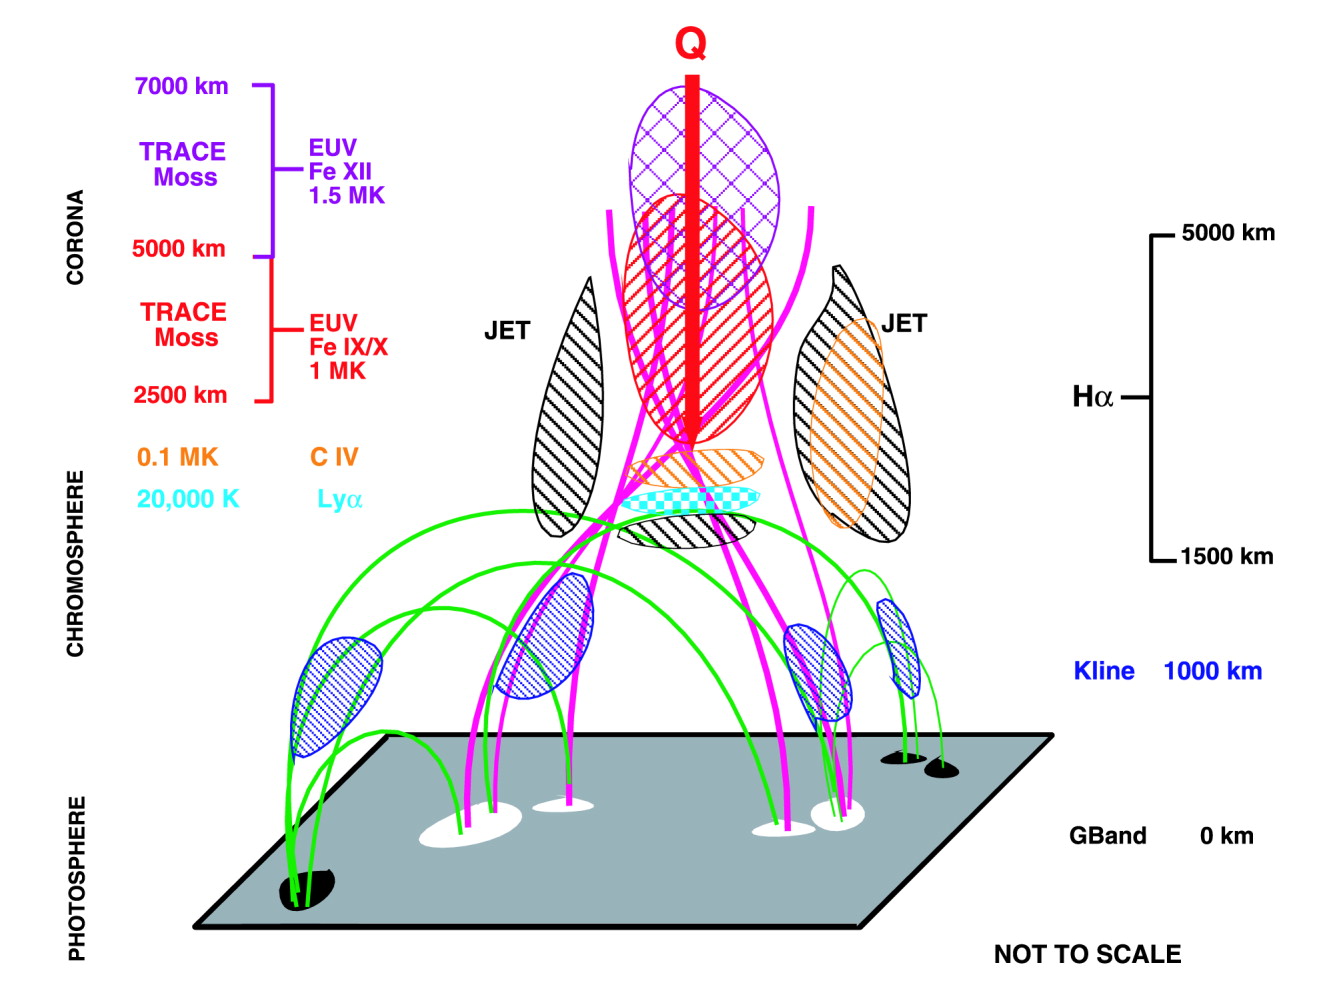
Neither a flare nor a CME cartoon, but a richly colored version of the Berger cartoon explaining "moss," with some value added. The moss is the conductively heated (conductive heat flux Q from overlying hot, high-pressure loops) EUV "classical" transition region visible in 171 Â and 195 Â emission, located at "chromospheric heights" above the photosphere and interacting with cool jets visible in images taken in the wings of H-α. Some of these jets are visible during their descent in C IV emission. The "classical TR" of coronal loops is also visible in H-α line center, Lyman-&alpha,; and, less clearly, C IV. In the lower chromosphere and photosphere, magnetic flux concentrations are demarcated by K line and G-band bright points, respectively. The field lines constituting the coronal loop anchor in many disparate elements. The chromospheric jets are constantly buffeting the moss emitting plasma on a timescale of 30 s. - the preceding parrots the authors' caption here.
This cartoon might seem fairly far afield from flares, but is it really? In any case it is kind of neat. Certainly the important details of what happens at the "lower boundary condition" of our interesting coronal events are important. Note though that if there is so much physics in this region, it is not such a good choice for the boundary condition of any numerical simulation.